Last week, a mom asked me on my Facebook page what constitutes good SAT scores.
I told her it depends on the caliber of the school. At some colleges a 1600 out of a 2400 score is above average while at other schools, applicants with that kind of score wouldn’t even be seriously considered. At some of the nation’s most prestigious schools, a 2100 could be borderline.
It’s always wise to look at the test score ranges at individual schools. You can find these scores on the College Board, COLLEGEdata and the federal College Navigator, as well as the Princeton Review and Fisk collegiate guide books.
The mother’s question prompted me to share some of the more interesting of the College Board’s latest SAT statistics. Here are eight stats that I bet you didn’t know:
1. The average SAT score earned by high schools students in the class of 2011 was 1500 out of a maximum of 2400 points. The overall score breaks down this way:
Math 514
Critical reading 497
Writing 489
2. Students who completed a core curriculum in high school scored an average of 143 points higher on the SAT than those who didn’t. The College Board defines a core curriculum as including at least four English, three math, three natural sciences and three social sciences/history classes.
3. Nearly 1.65 million high school students from the class of 2011 took the SAT, which is a record.
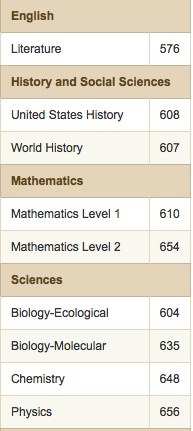
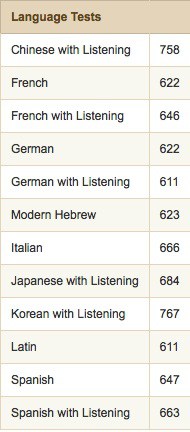
4. You hear far less about the scores for the SAT subject tests, which are chiefly required for elite colleges and universities. Here are the average scores for the subject tests:


5. The College Board breaks down SAT test performance by states. You can find the report card for your state here: College-Bound Seniors 2011 State Reports.
6. The best indicator of whether a child will succeed in college is his or her high school grade point average. The SAT is a weaker measure and it’s supposed to give colleges an idea of how applicants would perform in their first year of college.
The College Board developed a readiness benchmark that indicates that a score of 1550 (out of a 2400 scale) means students have a 65% likelihood of achieving a B- average or higher during their freshman year. Here is a college readiness graph from the College Board:
7. Forty four percent of test takers in the class of 2011 were minority students, which it the most diverse group of test takers ever. Thirty six percent of test takers were first-generation college goers and 27% don’t speak English exclusively.
8. More than 350,000 low-income students (21% of all test takers) obtained SAT fee waivers so they could take the test for free. If you know someone who could qualify for a fee waiver tell them.
More from The College Solution:
7 Ways to Boost Your ACT or SAT Scores
SAT and ACT: Which is the Better Test?
Should You Apply to a Reach School?
Winning College Admission Essays
Lynn O’Shaughnessy is the author of The College Solution, an Amazon bestseller and a workbook, Shrinking the Cost of College: Great Ways to Cut the Cost of a Bachelor’s Degree. Follow her on Twitter and Facebook.

A great informative post and very timely. My high school junior took the SAT for the first time on Saurday. I know she is a little anxious to see her scores on the 22nd.
It’s not obvious to me how to find the test score ranges of individual schools you mention on either the College Board or COLLEGEdata web sites.